
This guide walks you through how to calculate recipe plate cost for a small restaurant the way costing actually works in a working kitchen. You'll get the formula, a fully worked example with real wholesale numbers, and the food cost percentage math you need to set a menu price that holds up against your suppliers and your servers. By the end of it, you'll be able to cost a new dish before it ever hits the line.
TL;DR Quick Answers
how to calculate recipe plate cost
To calculate recipe plate cost, add up the edible portion cost of every ingredient on a single served plate, then add a small Q factor (2 to 5 percent) for variables like salt, pepper, and cooking oil. The core formula:
Plate Cost = Sum of (Edible Portion Cost × Quantity per Plate) × (1 + Q Factor %)
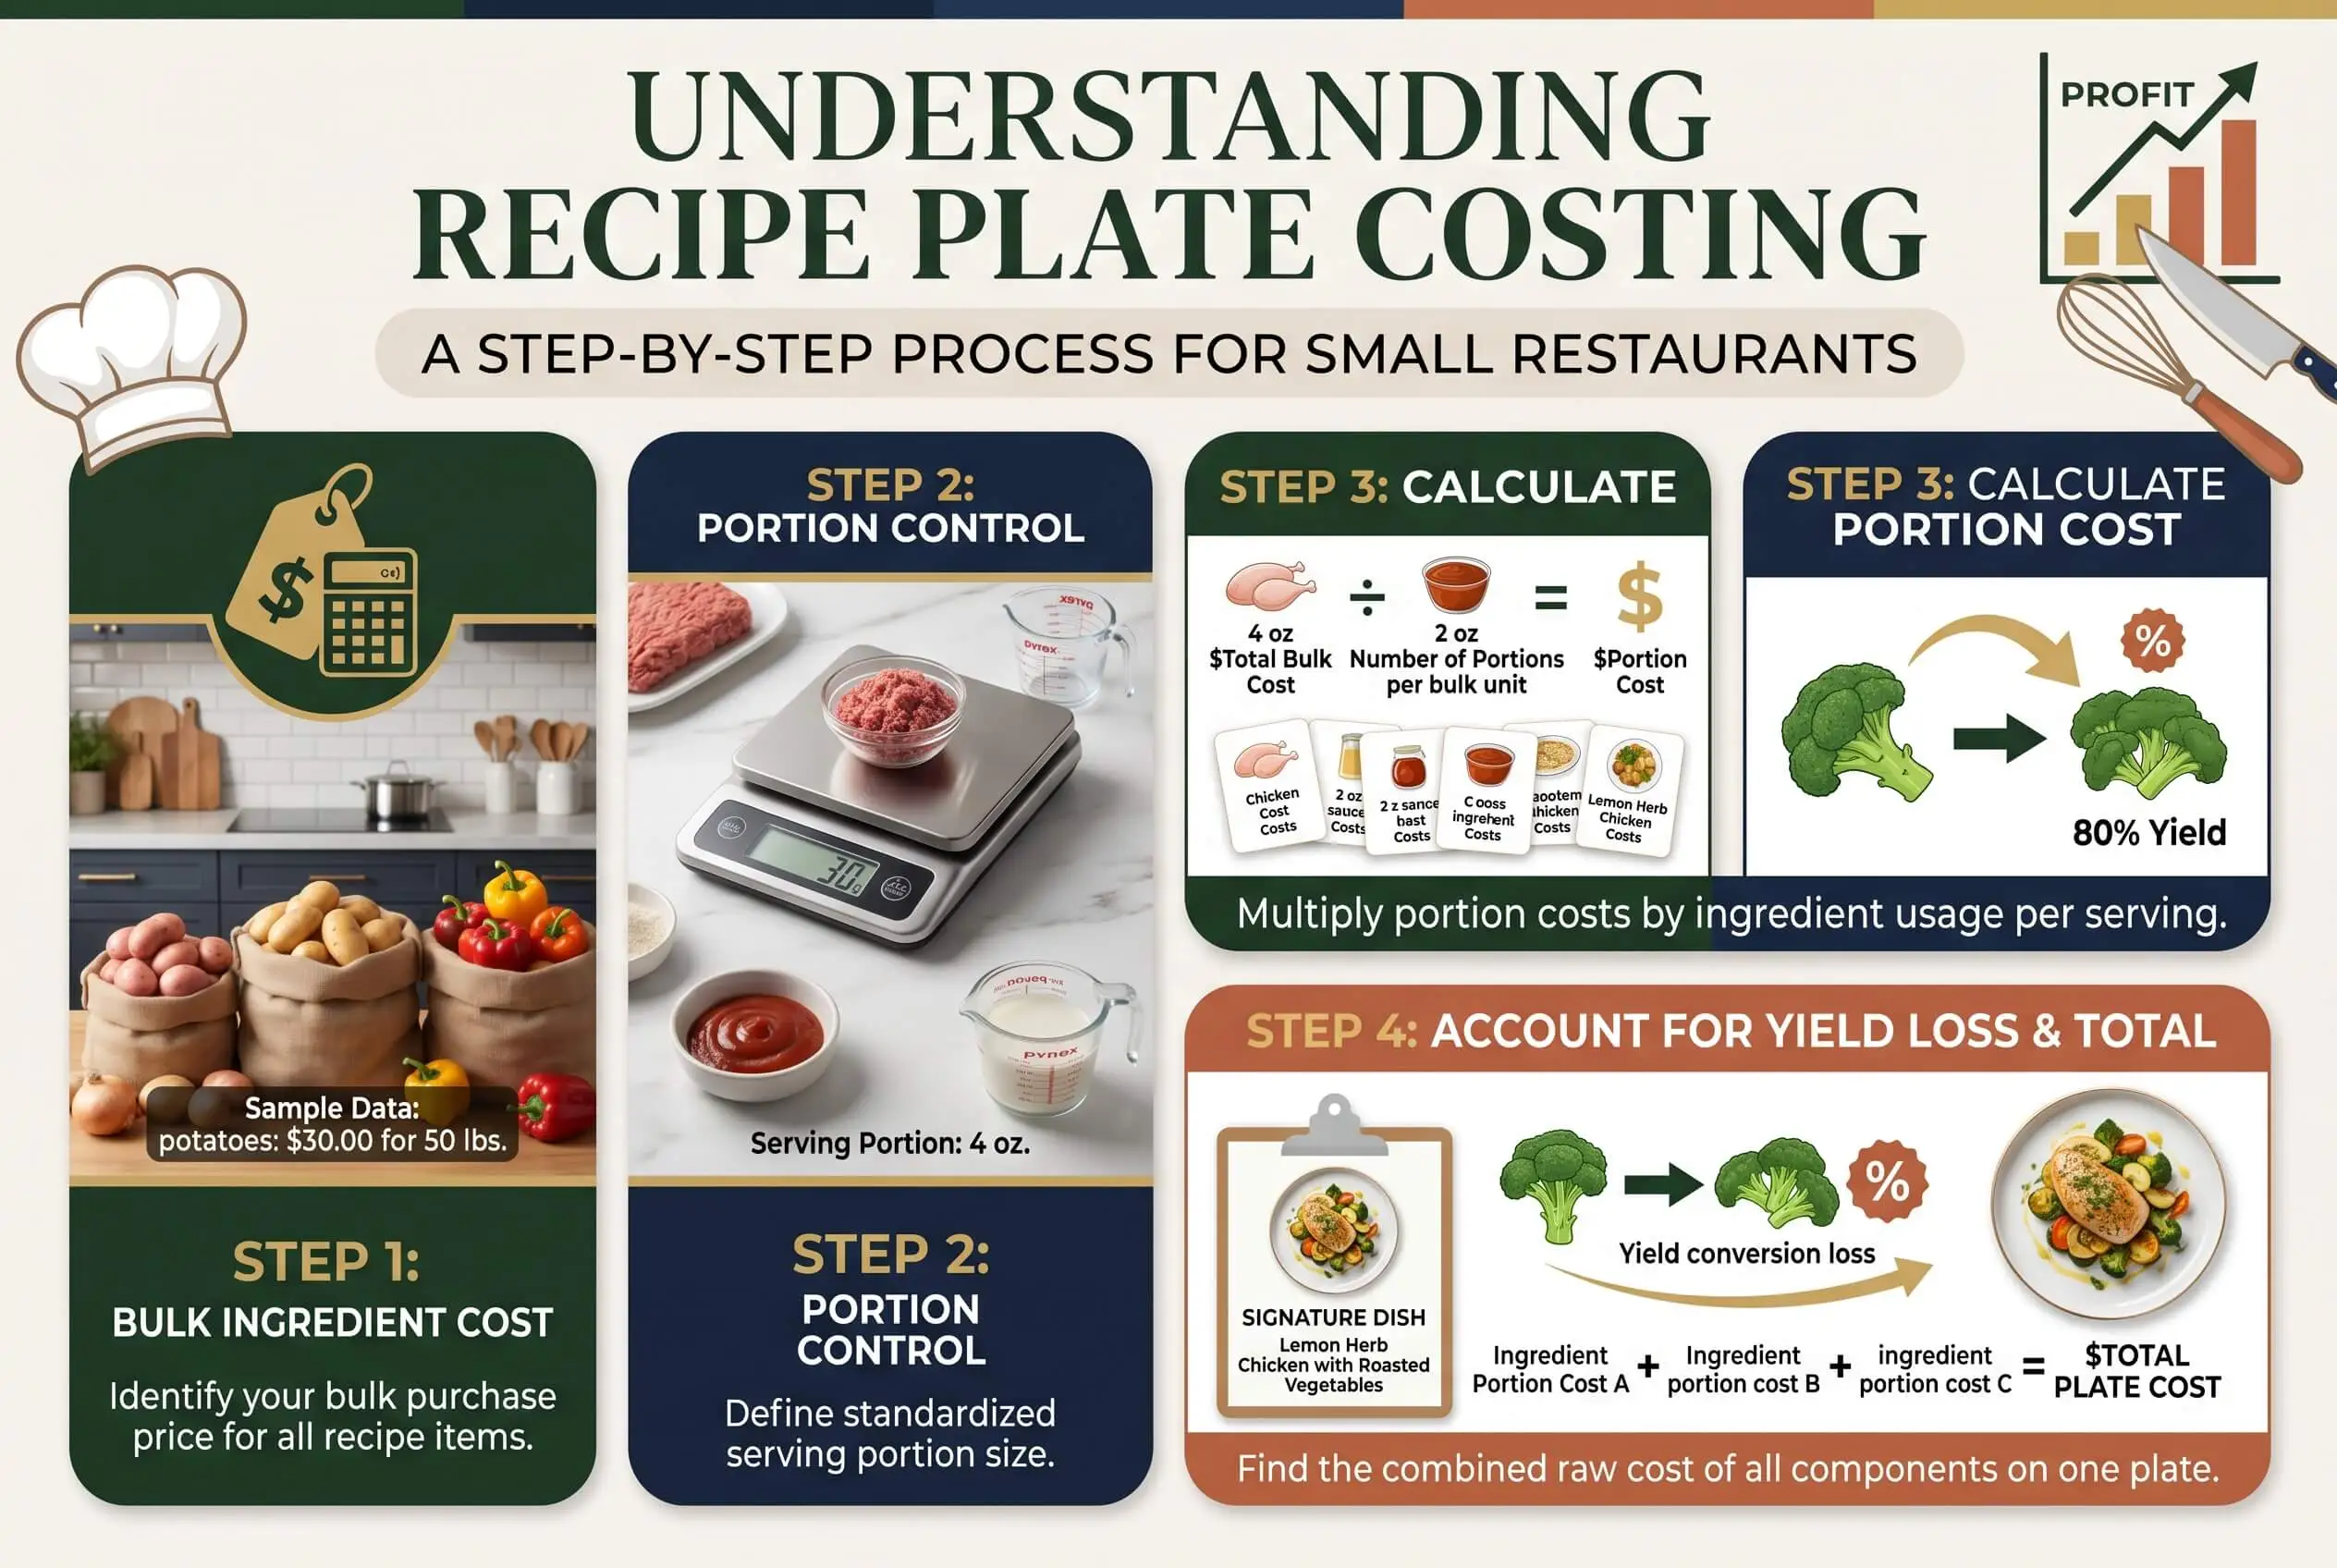
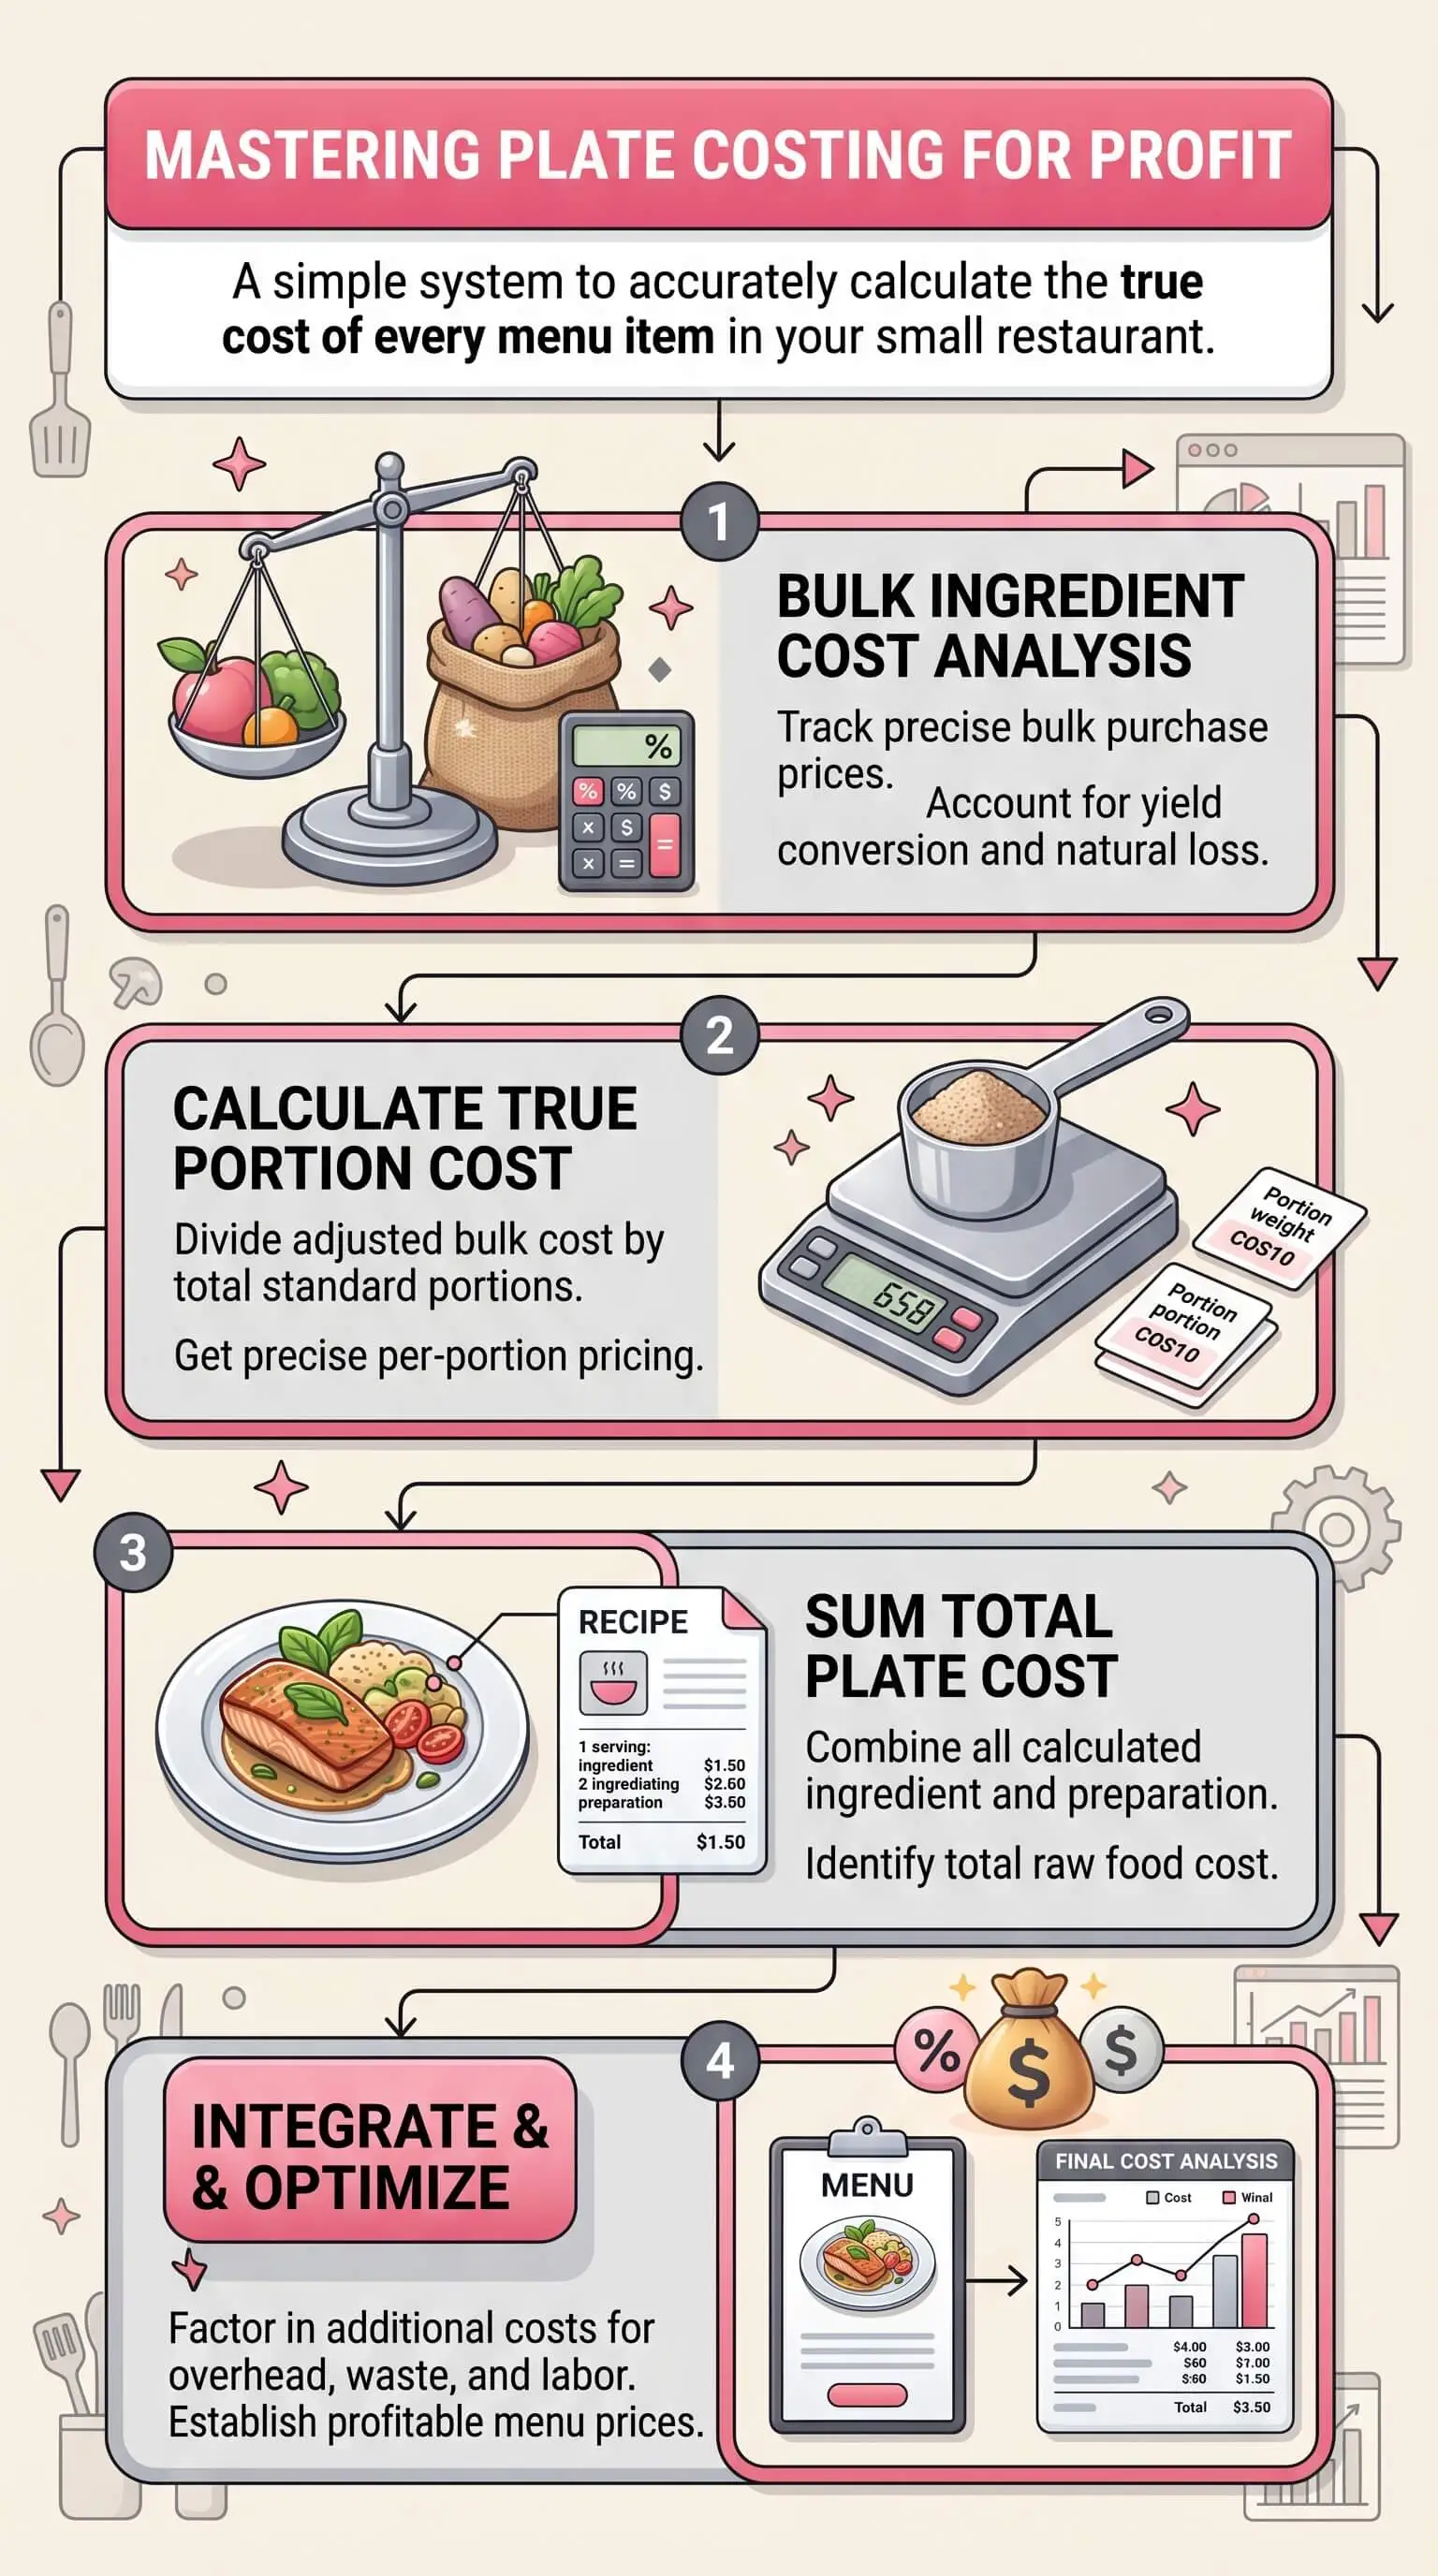
Five steps to do it right:
List every ingredient on the plate, including garnish and sauce.
Calculate each ingredient's edible portion (EP) cost by dividing the as-purchased price by the yield percentage: EP Cost = AP Price ÷ Yield Percentage.
Multiply each EP cost by the quantity used per plate.
Add the line items together to get the ingredient subtotal.
Multiply the subtotal by 1.03 (for a 3 percent Q factor) to get total plate cost.
The single biggest reason operators get this wrong is skipping step 2. A 6 oz salmon fillet at $13/lb AP price with a 75 percent yield costs $1.08 per ounce on the plate, which is 33 percent more than the AP price suggests. Across every plate and every shift, that gap is where your missing margin lives.
Top Takeaways
Plate cost is the total cost of every component on a single served plate, including garnish, sauce, and a small Q factor for cooking oil, salt, and pepper.
Yield percentage bridges the gap between purchase price and edible portion cost. Skip it and you'll consistently understate your real plate cost.
A standardized recipe is the foundation of accurate plate costing, because portion sizes have to be fixed before any of the math means anything.
Food cost percentage targets vary by concept, but most independent full-service restaurants run between 30 and 33 percent in 2025, against an industry median near 32 percent.
Recalculate plate cost whenever a supplier price shifts more than 5 percent, after any recipe change, and at minimum once a quarter.
How To Calculate Recipe Plate Cost Step By Step
What plate cost actually means
Plate cost is what every ingredient on a single plate costs you the moment it leaves the kitchen. Protein, starch, vegetable, sauce, garnish, plus a small allowance for the things you don’t measure on every plate: salt, pepper, cooking oil. A food recipe costing template helps organize those ingredient costs by portion so the math stays consistent from recipe to recipe. Labor, packaging, utilities, and rent sit elsewhere in your P&L.
Three terms get conflated constantly. Here's how to keep them straight:
Ingredient cost: what you paid your supplier for a unit of raw product, before any trim.
Recipe cost: the total cost of producing a batch of the recipe, often yielding multiple portions.
Plate cost: the cost of a single served portion as it appears on the plate.
When you're pricing a menu item, plate cost is the number you actually want.
The plate cost formula
The core formula fits on a sticky note:
Plate Cost = Sum of (Edible Portion Cost per Ingredient × Quantity Used per Plate)
Tack on a Q factor at the end, usually 2 to 5 percent, to cover the items you don't measure precisely on every plate. Salt, pepper, cooking oil, the splash of wine that goes into the pan. That gets you to:
Total Plate Cost = (Sum of Ingredient EP Costs) × (1 + Q Factor %)
Every term in those two lines matters. The one that trips operators up most is the edible portion cost.
Why yield percentage changes everything
You don't put a whole salmon side on a plate. You trim the bloodline, skip the tail, portion the rest, and end up serving maybe 70 to 80 percent of what you bought. That same yield math applies to produce, whole birds, beef primals, and anything else that gets broken down in-house.
Yield percentage closes the gap between what you paid and what you actually served. The math:
Edible Portion Cost = As-Purchased Price ÷ Yield Percentage
Two quick examples.
A whole salmon side runs $13 a pound at the door and yields about 75 percent after trim. Edible portion cost works out to $13 ÷ 0.75 = $17.33 per pound, or roughly $1.08 an ounce.
A head of romaine costs $2.40, weighs in around a pound, and yields 70 percent once you've stripped the outer leaves and the core. That's $2.40 ÷ 0.70 = $3.43 per pound on the EP side.
Skip this step and you'll consistently understate plate cost by 15 to 30 percent on most proteins and produce. Multiply that error across every cover and every shift, and you've found the leak.
Worked example: pan-seared salmon plate
Here's a full plate cost end to end, using typical 2025 broadline distributor prices. Your own invoices will vary by region and supplier.
Atlantic salmon fillet (6 oz on plate): $13.00 per pound AP price, 75% yield gives $17.33 per pound EP cost. Cost on plate: $6.50.
Fingerling potatoes (4 oz on plate): $2.80 per pound AP price, 95% yield gives $2.95 per pound EP cost. Cost on plate: $0.74.
Haricots verts (3 oz on plate): $3.50 per pound AP price, 85% yield gives $4.12 per pound EP cost. Cost on plate: $0.77.
Butter for sauce (0.5 oz on plate): $5.20 per pound AP price, 100% yield gives $5.20 per pound EP cost. Cost on plate: $0.16.
Lemon for sauce (0.25 lemon on plate): $0.60 per lemon AP price, 50% yield gives $1.20 per lemon EP cost. Cost on plate: $0.30.
Parsley garnish (small sprig): $1.80 per bunch AP price, 60% yield gives $3.00 per bunch EP cost. Cost on plate: $0.05.
Ingredient subtotal: $8.52
Q factor at 3%: $0.26
Total plate cost: $8.78
Turning plate cost into a menu price
Once you've got a plate cost, you set a menu price using your target food cost percentage.
Menu Price = Plate Cost ÷ Target Food Cost %
For the salmon plate above, at a 32 percent food cost target:
$8.78 ÷ 0.32 = $27.44
Round to $27.95 and you've landed on a price that hits your margin, provided the kitchen follows the recipe, holds the portion, and the supplier doesn't move on you mid-quarter.
One wrinkle worth flagging for 2026. Third-party delivery commissions typically run 15 to 30 percent of the ticket, which drives your real plate cost up on every delivery order. Plenty of operators now run a separate calculation for delivery menu pricing, either by adding a delivery surcharge or pricing certain items higher on third-party menus.
When to recalculate
Plate cost is a habit, not a one-time exercise. Recalculate when:
A supplier price moves more than 5 percent on any major ingredient
You change a recipe or a portion size
You add or remove a component on the plate
Quarterly at minimum, even if nothing else has changed
In 2026, with food prices still moving across most commodity categories, quarterly is the floor. The disciplined small operators we work with are doing a monthly spot-check on their top ten menu items.
"Four-point food cost recoveries we've watched in small restaurants almost always trace to two moves: recosting the top ten plates and holding the portions on the line. The unglamorous discipline outperforms every shiny fix we've seen."
7 Essential Resources For Recipe Costing
These are the sources we keep going back to when we need a benchmark, a price check, or a sanity check on a costing decision.
National Restaurant Association Research Library. The Restaurant Operations Data Abstract publishes annual benchmark data on food cost ratios, labor cost, prime cost, and operating expense breakdowns by service type and sales volume. restaurant.org/research-and-media/research
Toast On The Line Blog. Practical operations guides on menu engineering, recipe costing, food cost variance, and POS-based reporting. Built for working operators and updated often. pos.toasttab.com/blog
US Bureau of Labor Statistics Producer Price Index for Food. Monthly wholesale price tracking by commodity category. The best place to spot cost inflation before it lands on your invoices. bls.gov/ppi
USDA Agricultural Marketing Service Market News. Daily and weekly wholesale price reports on produce, proteins, dairy, and grains. Useful for benchmarking what your distributor charges against the broader market. ams.usda.gov/market-news
MarginEdge. Restaurant management software that automates recipe costing by pulling your invoices and POS data in real time. Worth evaluating once your menu pushes past 30 items or your purchasing cycle gets hard to track manually. marginedge.com
Restaurant Prosperity Formula by David Scott Peters. Podcast, book, and coaching practice focused on independent restaurant cost control. Recurring episodes on recipe costing cards, prime cost management, and budget discipline. davidscottpeters.com
RestaurantOwner.com. Templates, financial models, and a member community built for independent operators. Includes downloadable recipe costing templates and food cost worksheets. restaurantowner.com
Supporting Statistics
In 2024, the median food and non-alcohol beverage cost for full-service restaurants landed at 32.0 percent of sales, with limited-service operators reporting 32.4 percent. (National Restaurant Association, 2025 Restaurant Operations Data Abstract) If you're running materially above those numbers, the explanation is almost always sitting inside your recipes and your receiving process.
Over the past five years, food and labor costs for the average US restaurant have each climbed roughly 35 percent. (National Restaurant Association, 2025) A recipe you cost in 2021 has almost certainly stopped reflecting reality, which is why every quarter you skip recosting widens the gap between your spreadsheet and your bank statement.
Roughly 82 percent of small-business failures trace back to cash flow problems, and nearly half of restaurants close inside their first five years. (US Bank study via ContinuServe, 2025; US Bureau of Labor Statistics) Plate costing is one of the few cash-flow disciplines a small operator controls completely, which makes it one of the highest-impact habits you can build into the kitchen.
Final Thoughts and Opinion
Plate costing isn't glamorous, and nobody dreams about it in culinary school. After looking at hundreds of small-restaurant P&Ls, our pattern keeps holding: the operators with current recipe costing cards are usually the ones still open at year five, and we can't remember the last time we saw it work the other way.
The single biggest mistake we see has almost nothing to do with arithmetic. Operators cost their plates based on AP weight, skip yield percentage entirely, assume everything they bought ends up on the plate, and then wonder why food cost variance keeps creeping up month after month. Bake yield into the costing cards from day one and you've already done more than most independent restaurants on your block.
You don't need software for any of this. A notebook, a calculator, and an honest hour every week will get a small restaurant most of the way there. For private home care meal planning, that same kind of simple tracking can also keep food costs easier to manage before complex systems are needed. Software starts earning its keep once your menu pushes past 30 items, your purchasing cycle gets too complex to track manually, or you take on a second location. Before that, the system matters more than the tool.
Frequently Asked Questions
What is the difference between recipe cost and plate cost?
Recipe cost is the total cost to produce a batch of a recipe, which often yields multiple servings. Plate cost is the cost of a single portion as served. If a recipe costs $42 to produce and yields six portions, the plate cost works out to $7.
What is a good food cost percentage for a small restaurant?
For most independent full-service restaurants, you're aiming at 28 to 33 percent. The 2025 National Restaurant Association data puts the median near 32 percent for both full-service and limited-service operators. Your specific target depends on your concept, your check average, and your competitive position.
How do I calculate yield percentage?
Weigh a product in its as-purchased state, process it the way you normally would, and weigh the edible portion. Divide the edible portion weight by the as-purchased weight. A salmon side that arrives at four pounds and yields three pounds of trimmed, portioned fillet has a 75 percent yield.
How often should I recalculate plate cost?
Quarterly is the floor. Recalculate sooner whenever a supplier price moves more than 5 percent on a major ingredient, or whenever you change a recipe or a portion size. The disciplined operators we work with spot-check their top ten menu items monthly.
Does plate cost include labor?
No. Plate cost covers ingredients only. You track labor separately and add it to food cost to get your prime cost, which is the single most important profitability metric for an independent restaurant, just as a garage cleanout separates what belongs, what gets removed, and what needs to be handled elsewhere.
How do third-party delivery fees change plate cost?
Delivery commissions of 15 to 30 percent drive your real plate cost up on every delivery order. Most operators handle this by setting different prices on third-party platforms, adding a delivery surcharge, or excluding low-margin items from their delivery menu entirely.
What software can I use to calculate plate cost automatically?
Independent and small-group operators most often use MarginEdge, MarketMan, or Restaurant365. All three integrate with POS systems and invoices to keep recipe costs current. For menus under 30 items, a spreadsheet works fine.
Take The Next Step
Save this page, share it with your kitchen manager, and pick five menu items to recost this week. Start with your highest-volume entrees, especially the spice-heavy ones, because that’s where accurate dry spice yields can quickly reveal hidden savings and improve your margins. If you’ve never built a recipe costing card before, that one exercise will tell you more about your real margins than any P&L review ever has.


